This is the Luxor obelisk at the Place de la Concorde in Paris. The date was actually April 11, 2008, not 2006.
Background on the celestial sphere and the gnomon
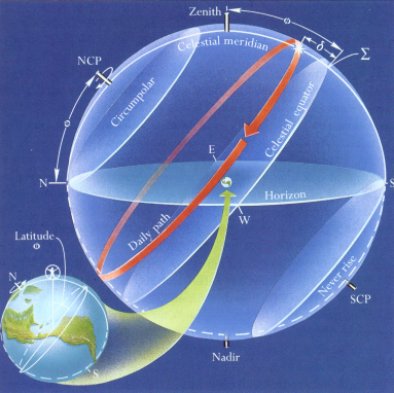
Because the Earth turns on its axis once a day, the Sun, Moon, and stars appear to move with respect to our local horizon. Here we see the celestial sphere:
I thank Jim Kaler for use of this diagram. More information can be obtained from his website by clicking here.
The pole star (Polaris) is very near the direction of the North Celestial Pole (NCP). The NCP is at an angle above the horizon equal to your latitude (PHI). If you are in Hawaii, the NCP is roughly 20 degrees above the horizon. If you are far north in Alaska the NCP might be 65 degrees above the horizon.
Halfway between the North Celestial Pole and the South Celestial Pole is the celestial equator. It is a projection of the Earth's terrestrial equator out to the celestial sphere. The number degrees that a celestial object is north or south of the celestial equator is its declination (DEC).
The celestial meridian divides the sky into its eastern half and its western half. A celestial object reaches its maximum elevation angle (h) above the horizon when it is on the celestial meridian. (Actually, the circumpolar stars, which do not set below the horizon, have an upper culmination and a lower culmination.) An object on the celestial equator transits the celestial meridian at elevation angle above the horizon equal to 90 - PHI. At latitudes further north than 23.45 degrees, the Sun always transits south of the zenith. Generally, given the Sun's declination (DEC), it transits the celestial meridian at elevation angle
h_max = (90 - PHI) + DEC
degrees above the horizon, and it takes the apparent path in the sky indicated by the red line in the diagram above.
The gnomon is probably the most ancient astronomical measuring instrument. While the word is used in several contexts , here we simply mean a vertical stick with a reasonably sharp point. I used a 3/8-inch wooden dowel rod sharpened with a pencil sharpener, and held vertical by a one foot length of two-by-four with a vertical hole drilled in it. I decided that the point of the gnomon should not be too sharp.
Useful astronomical observations should have accurate associated time stamps. Astronomers prefer Greenwich Mean Time. The GMT at noon gives you a pretty good clue as to what time zone you live in. Central Standard Time in the USA is six hours behind GMT, meaning that local noon occurs at roughly 18 hours GMT. Another way of saying this is that the Central time zone is roughly 6 * 15 = 90 degrees west of Greenwich, England.
Since the Sun is about 0.5 degrees in angular size, the gnomon does not cast a perfectly sharp shadow. Thus, one of the tricks is to decide exactly what corresponds to the "end of the shadow of the stick".
Apparent noon occurs when the Sun is highest in the sky -- in other words, when the shadow of the vertical stick is shortest.
One's latitude can be determined by taking a series of measurements of the length of the shadow of a vertical stick. It is best to measure the length of the shadow from, say, 100 minutes before the time of local apparent noon until 100 minutes after local apparent noon. Depending on where one is situated (east-west) in a particular time zone and depending what day of the year it is, apparent noon can occur many, many minutes from noon Standard Time or 1 PM Daylight Time . Consider two observers situtated in the same time zone but one degree of longitude apart. If the more eastern observer observes the Sun to transit the celestial meridian at, say, 12:05 PM, the observer one degree of longitude to the west will observe the Sun to transit the meridian at 12:09 PM. But we are getting somewhat ahead of the story here.
One final consideration
Imagine you are an ant with sunglasses walking around on the posterboard when someone is doing their gnomon experiment. If you are on the poster at a location to look up at the Sun and see the point of the gnomon exactly lined up on the center of the Sun, are you in the umbral shadow ? No. You can still see the top half of the Sun. So -- what the length of the umbral shadow and the height of the gnomon give us the elevation angle of the upper limb of the Sun. Thus, to get our most accurate value for the latitude, we must add in the radius of the Sun. This averages to 16 arcminutes.
Determining the latitude and longitude in South Bend, Indiana
In the next diagram we show the position of the end of the shadow of our gnomon, as measured in South Bend, Indiana, on September 3, 2006. My location was at the fountain just north of Nieuwland Science Hall at the University of Notre Dame.
In the plot the +Y-direction in the plot is due north. Notice the slight convex shape of the set of green points.
Here we plot the length of the shadow vs. the time since 1:35 PM Eastern Daylight Time. Using a parabolic fit to the data points, I found that the average deviation from a parabola was just about 1 millimeter. It certainly helped to have set up the gnomon on a nicely flat and level surface. I would recommend laying out a large piece of paper, taping it down, and taping the gnomon holder to the paper, so that nothing can move over the course of the 3 or 4 hours that one takes the measurements. If the level surface is somewhat rough, then, instead of paper, it is better to use a large sheet of blank cardboard. You may wonder why there are gaps in the data. Some of the time the Sun was covered by clouds.
From the Astronomical Almanac I determined that the coordinates of the Sun on September 3, 2006, at 17.7 hours GMT. The right ascension of the Sun was RA = 10 hours 50 minutes 16.90 seconds. The declination of the Sun was DEC = +7 degrees 24' 33" = +7.4092 degrees.
Just as the declination is the celestial analogue of latitude on the Earth, the right ascension is the analogue of longitude. The RA of a celestial object is the number of hours, minutes, and seconds that an object is east of the vernal equinox . The vernal equinox is the position of the Sun at the first moment of (northern) spring (about March 20th). You may know the vernal equinox in the following context. The weatherman on TV might say, "The vernal equinox occurs tomorrow at thus-and-so time." The vernal equinox can be thought of as a moment in time, or as a position on the celestial sphere.
A list of the right ascension and declination of the Sun for each day of the present year can be obtained by clicking here.
Now we have to do some simple trigonometry. The tangent of the elevation angle above the horizon is equal to the height of the gnomon (g) divided by the minimum length of the shadow (L_min). In other words:
tan(h_max) = g / L_min = 635 / 431.3.
Using a calculator it follows that h_max = 55.8152 degrees, and
PHI = (90 - 55.8152) + 7.4092 = 41.5940 degrees . (So far this ignores the correction for the semi-diameter of the Sun.)
This is the same as 41 degrees 35.6 minutes. From an uncertainty of +/- 1 mm for the height of the gnomon and +/- 0.95 mm for the uncertainty of L_min, it follows that the uncertainty of our latitude is about 0.05 degrees = 3.0 nautical miles. (1 nautical mile = 1852 meters = 1.151 statute miles.)
The radius of the Sun on this date was 15.9 arc minutes, so our final value for the latitude is 41 deg 35.6' + 15.9 = 41 deg 51.5'.
In order to determine the longitude we note that there is a difference between apparent solar time and mean solar time . The numerical difference is called the equation of time . It comes about as a result of the tilt of the Earth's axis of rotation to the plane of its orbit (the obliquity of the ecliptic ) and the ellipticity of the Earth's orbit. For more information on the equation of time click here.
XXX For a table of the equation of time vs. day number of the year click here.
Our clock time is the mean solar time at some reference longitude. For Eastern Time that reference longitude is 75 degrees west of Greenwich. For Central time the reference longitude is 90 degrees west of Greenwich.
From the Astronomical Almanac I determined that the equation of time on September 3, 2006, was +51 seconds. Thus, the fictitious mean Sun transitted the meridian at 1:42:31 + 00:00:51 = 1:43:22 EDT = 12:43:22 Eastern Standard Time.
South Bend, Indiana, is in the Eastern time zone (5 hours behind Greenwich). Thus, the observations imply that the derived latitude at our location in South Bend, Indiana, was 5 hours 43 min 22 sec west of Greenwich. Since 1 hour of time corresponds to 15 degrees of longitude, our derived longitude is 5 + 43/60 + 22/3600 = 5.722778 hours * 15 deg/hr = 85.8417 deg = 85 deg 50.5'. Given the uncertainty of our derived time of transit, the uncertainty of our derived longitude is +/- 8.8'.
From a map of South Bend I derived that my true latitude was PHI = +41 deg 42.05', and true longitude = W 86 deg 14.2'. The systematic errors of my measurements are as follows:
systematic latitude error = 41 deg 51.5' - 41 deg 42.05' = +9.45'
systematic latitude error = 85 deg 50.5' - 86 deg 14.2' = -23.7'
We can compare these to our random errors of +/- 3.0' for latitude and +/- 8.8' for longitude, which come from the scatter of our shadow measurements. The ratio of systematic error to random error is a measure of the robustness of the data. In this case |+9.45/3.0| ~ 3.2 for latitude and |-23.7/8.8| ~ 2.7 for longitude. If these two ratios were close to 1.0, it would imply that we have no significant systematic errors, and that the experiment could hardly be improved using the same equipment. The fact that these numbers are between about 3.0 means that there is a 1 percent probability that the observed values differed from the "true" values by chance alone. If the systematic error were, say, 20 times the random error, that would be an indication that the data are affected by serious systematic errors.
Since the lines of longitude converge at the Earth's geographic poles, to determine the linear error in longitude, we must multiply the longitude error in angular units by the cosine of the latitude. Thus, our east-west error from the true position was -23.7 * cosine (PHI) = -23.7 * 0.7466 = -17.7 nautical miles. Our total positional error is SQRT (6.45 * 6.45 + 17.7 * 17.7) = 18.8 nautical miles.
We located our position on the Earth to within 19 nautical miles using a short list of simple things: a vertical stick, the Astronomical Almanac, a watch, a source of Greenwich Mean Time, a big sheet of paper (or cardboard), duct tape, a pencil, and a tape measure calibrated in millimeters (or a meter stick).
Determining the latitude and longitude in College Station, Texas - Part 1
On November 12, 2006, I made a similar set of shadow measurements from the fountain just south of the Zachary Engineering Building at Texas A & M University. I am told that this fountain is never turned on. Though the surface is quite rough, it appears nice and level. Because of the roughness, I spread out a large piece of cardboard, taped it to the stone with duct tape, and then taped the gnomon holder to the cardboard for the duration of the shadow measurements.
Here is an X-Y plot of the shadow positions. Note the concave nature of the run of green points. This is because the Sun was more than 17 degrees south of the celestial equator.
The shadow length vs. time since noon is given below:
For the College Station measurements I need not describe every step with words as I did above. I shall just give some the basic numbers.
From the Astronomical Alamanac the coordinates of the Sun were: RA = 15 h 11 m 5.2 s; DEC = -17 deg 47' 56.4" = -17.7990 deg.
Equation of time = 15 min 46.5 sec.
Semi-diameter of the Sun = 16.2 arcmin.
tan(h_max) = 633 / 704.99; h_max = 41.9201 deg.
latitude PHI = 90 - h_max + DEC_Sun = 90 - 41.9201 - 17.7990 = 30.2809 deg = 30 deg 16.9'. Adding in the semi-diameter of the Sun gives a final latitude value of 30 deg 33.1'. Given the uncertainty of +/- 1 mm for gnomon height and +/- 1.33 mm for the minimum shadow length, the corresponding uncertainty of the derived latitude is +/- 4.7' = 4.7 nautical miles.
The fictitious mean Sun transitted the celestial meridian at 12:07:02.5 + 00:15:46.5 = 12:22:49.0 CST. Thus, our location was measured to be 22 m 49 sec of longitude west of the 6 hour meridian. 6 + 22/60 + 49/3600 = 6.38028 hours * 15 deg/hr = 95.7042 deg = 95 deg 42.25'. From the uncertainty of +/- 38.2 sec in the transit time of the apparent Sun, the random error of the longitude is 9.54'.
From Google Earth we determined that our true latitude was +30 deg 37' 14.8". Call it 30 deg 37.2'. And the true longitude was W 96 deg 20' 26.3". Call it 96 deg 20.44'.
Systematic error in latitude = 30 d 33.1' - 30 d 37.2 = -4.1'
Ratio of systematic error to random error for latitude = |-4.1/4.7| = 0.9
Systematic error in longitude = 95 d 42.25 - 96 d 20.44' = -38.2' of longitude.
Ratio of systematic error to random error for longitude = |-38.2/9.54| = 4.0.
Linear systematic error in longitude = -38.2 * cosine (PHI) = -38.2 * 0.8606 = -32.9 nautical miles.
Total distance error = SQRT (4.1 * 4.1 + 32.9 * 32.9) = 33.2 nautical miles. Our latitude value could hardly be improved using this equipment, as the systematic error is comparable to the random error. For longitude the ratio was 4, meaning that we could probably do better for longitude if we tried again. Some of possible ways to improve the measurements are listed below.
A prediction for the first day of spring/autumn
It can be shown that when the declination of the Sun is 0 (the moment of the vernal equinox or the autumnal equinox), the end of the shadow of the gnomon will trace an east-west path on the level ground. It will not be convex as in the X-Y plot for South Bend on September 3rd shown above, or concave as in the X-Y plot for College Station on November 12th also shown above. The Y-axis coordinate will be equal to the height of the gnomon times the tangent of the latitude. Here we show a prediction for the shadow of a gnomon on the first day of spring or the first day of autumn.
The actual data from the second day of autumn, 2007 (see below), very nearly match this prediction.
Determining the latitude and longitude in College Station, Texas - Part 2
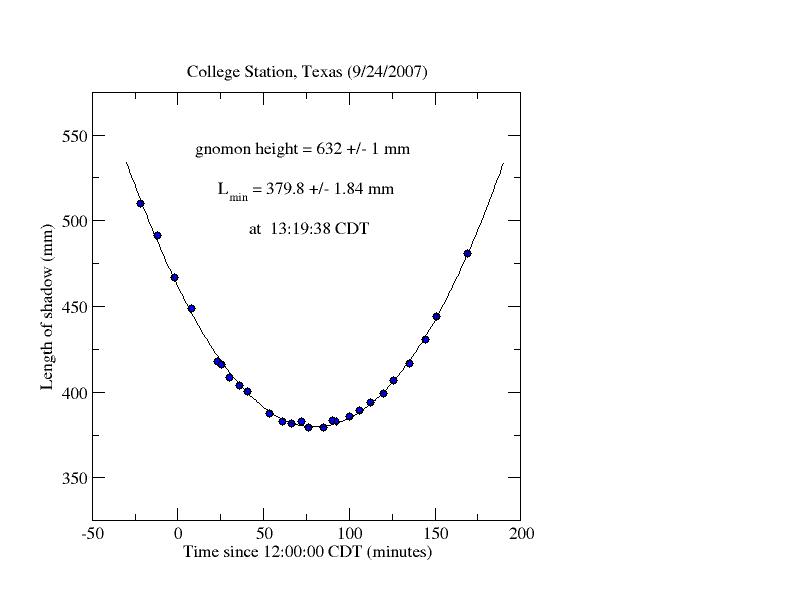
On September 24, 2007, I made another set of shadow measurements from the same location at Texas A & M University. Since this was one day after the start of autumn, the declination of the Sun was very close to zero. When it is exactly zero (on the first day of spring and the first day of autumn) the shadow points should lay along a straight line on the ground.
Here is an X-Y plot of the shadow positions. With some scatter, the points do lie along an east-west line.
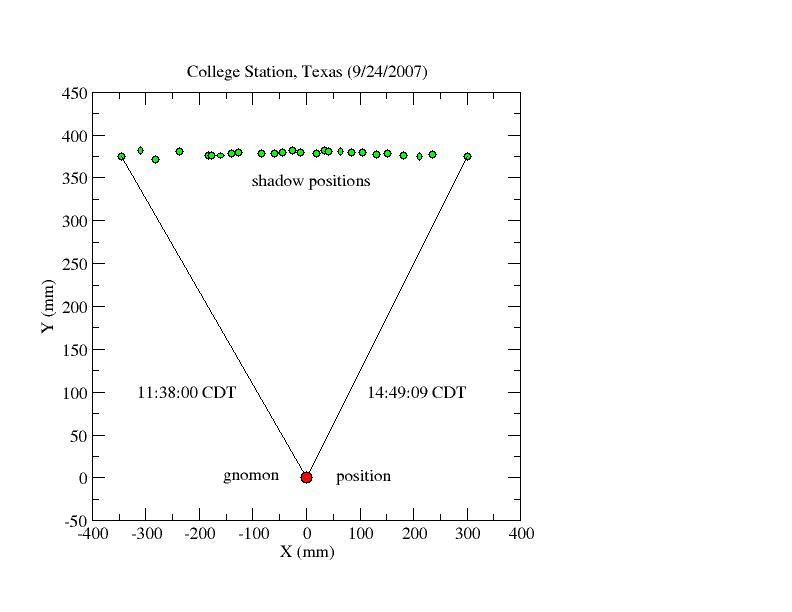
The shadow length vs. time since noon is given below. The gnomon height was 632 mm, with an uncertainty of +/- 1 mm.
On this date the coordinates of the Sun were: RA = 12 h 4 m 48 s; DEC = -0 deg 31' 19" = -0.5219 deg.
Equation of time = 8 min 8 sec.
Semi-diameter of the Sun = 15.9'.
tan(h_max) = 632 / 379.8; h_max = 58.9963 deg.
latitude PHI = 90 - h_max + DEC_Sun = 90 - 58.9963 - 0.5219 = 30.4818 deg = 30 deg 28.9'. Adding in the semi-diameter of the Sun gives a final latitude value of 30 deg 44.8'. Given the uncertainty of +/- 1 mm for gnomon height and +/- 1.84 mm for the minimum shadow length, the corresponding uncertainty of the derived latitude is +/- 7.7' = 7.7 nautical miles.
The fictitious mean Sun transitted the celestial meridian at 13:19:38 + 00:08:08 = 13:27:46 CDT. Thus, our location was measured to be 27 m 46 sec of time west of the 6 hour meridian. 6 + 27/60 + 46/3600 = 6.38028 hours * 15 deg/hr = 96.9417 deg = 96 deg 56.5'.
[Note about derived value of the transit time: The plot of shadow length vs. the number of minutes since noon CDT was fit with a least-squares parabola. The coefficients of that fit allow us to derive the length of the minimum shadow, and the corresponding time. That time was 13:20:05 CDT. But this does not use all information available to us. Since the gnomon was taped down to the cardboard and cardboard was taped to the cement, we can derive the X-Y coordinates of the points. I marked the nominal transit time on the cardboard and measured the nominal X coordinates of the points. The Y coordinates of the points can be obtained using the Pythagorean theorem. Y^2 = L^2 - X^2. A plot of Y vs. X should be a straight line of zero slope so close to the autumnal equinox. I then added [-4,-2, +2, and +4] mm to the X coordinates and re-derived the Y values. This, in effect, was trying out different transit times. A plot of the slopes of the linear fits vs. those offsets allowed me to determine the offset that gives the most horizontal fit of Y vs. X. It was obtained by moving the transit line 1.46 mm counterclockwise at a radius equal to the minimum shadow length. This corresponded to making the transit time 27 seconds earlier, or 13:19:38.]
From Google Earth we determined that our true latitude was +30 deg 37' 14.8" ~ 30 deg 37.2'. The true longitude was W 96 deg 20' 26.3" ~ 96 deg 20.44'.
Systematic error in latitude = 30 d 44.8' - 30 d 37.2 = +7.6'
Ratio of systematic error to random error for latitude = |7.6/7.7| ~ 1.0
Systematic error in longitude = 96 d 56.5' - 96 d 20.44' = +36.1' of longitude.
Our two determinations of latitude gave an unweighted mean of 30 deg 39.0' +/- 5.9'. The true value of latitude is 30 deg 37.2'. Our systematic error was 1.8' = 1.8 nautical miles. The random error was +/- 5.9 nautical miles. Our two longitude measurements give an unweighted mean value of 96 deg 19.4' west (with an uncertainty of +/- 37.1' of longitude). Our mean value is remarkably close to the true value of 96 deg 20.4'. The systematic error is only 1 arc minute of longitude, which corresponds to only 4 seconds of time. The random error of our mean value of longitude has an uncertainty of 37.1 arc minutes, which corresponds to 2 minutes 28 sec of time.
Taken at face value our mean latitude had a systematic error that was only 1.8 nautical miles north of the true location. This was more accurate than I thought one could accomplish with such crude equipment.
Our mean longitude value had essentially no systematic error, but the random error of the longitude was much greater than the random error of the latitude. The linear random error of longitude was +/- 37.1 times cos(PHI) = +/- 32.0 nautical miles. The random error of latitude was +/- 6.0 nautical miles. The ratio of those random errors is 5.3. Thus, the error ellipse is very much stretched out in the longitude direction.
The quest for accurate longitude at sea was one of the biggest technical challenges of the 18th century. The British government offered a substantial prize to whomever could determine longitude to 1 minute of time (or 1/4 of a degree). This problem was eventually solved by the chronometer maker John Harrison (1693-1776). For more information, click here.
Determining the latitude and longitude in College Station, Texas - Part 3
It was suggested that to get around the fuzzy nature of the umbral shadow of a pointed stick (see above) we fashion a little sphere at the end of the gnomon, as follows:
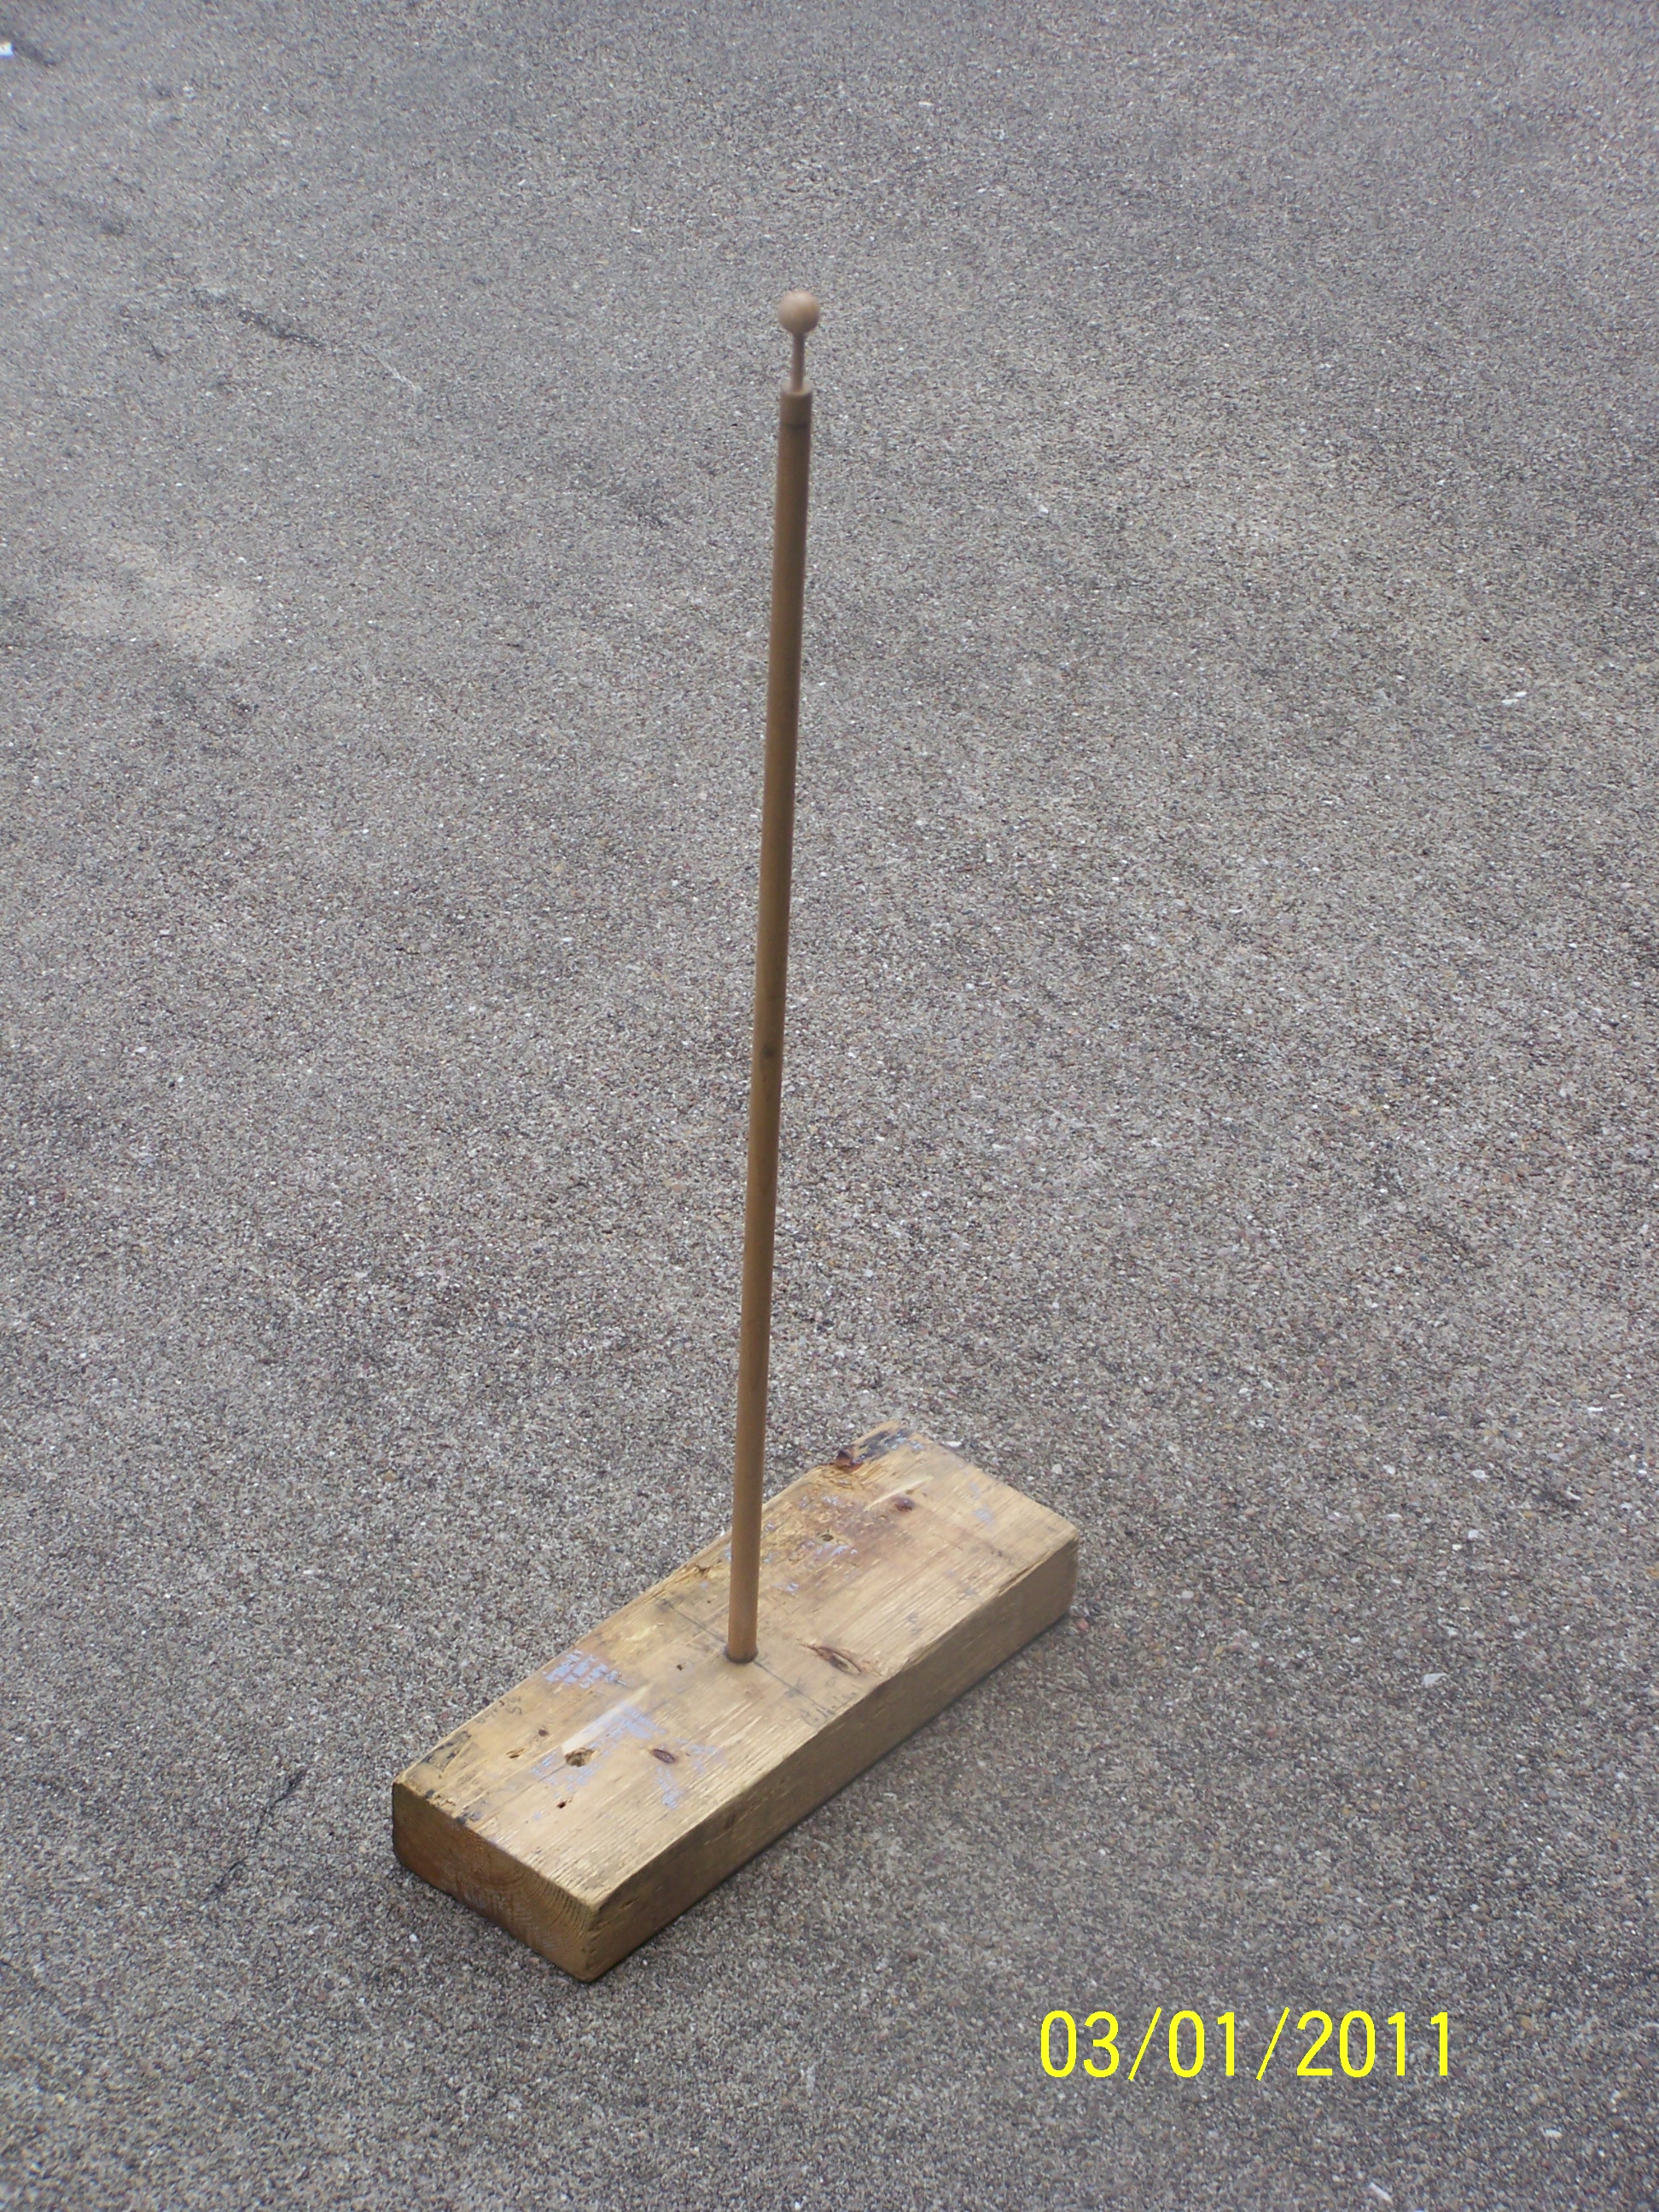
The shadow of the ball will be an ellipse, and the center of the ellipse might be easier to mark than the end of the darker shadow of a pointed stick.
On 20 June 2010 and 21 June 2010 we conducted two gnomon experiments at Texas A&M. This was to measure the maximum elevation angle that the Sun can achieve all year long. The summer solstice occurred at 6:28 AM PDT on the 21st. On June 21st students were sent to make the measurements between 12:15 PM and 1:25 PM. Here are the shadow length measures on June 21st.
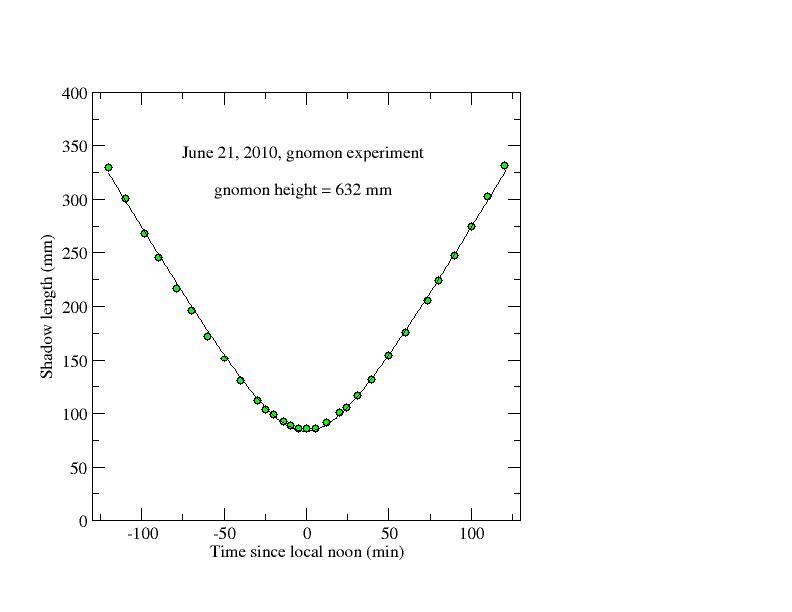
We have fit the June 21st data with a hyperbola of the form: y^2/b^2 - x^2/a^2 = 1, with a = 32.033 and b = 83.59.
This next figure shows the X-Y positions of the end of the shadow of the gnomon on the first day of winter (top), the day after the autumnal equinox (middle), and the first day of summer (bottom). For the middle and bottom loci the gnomon height was 632 mm. For the top locus I have scaled the X-Y the data by 632/550, as the gnomon height was 550 mm and I want to show what would have been observed had we used a 632 mm high gnomon for all three datasets. Note how the curvature is upward if the Sun's declination is negative, there's a straight line across for the autumnal equinox, and the curvature is downward for positive declination.

In fact we can do some simple spherical trig to derive the Sun's declination from these observations without any reference to the Astronomical Alamanac.
cos(DEC) = - sin(AZ) * cos(h)/sin(t),
where AZ is the azimuth of the Sun, h is the elevation angle, and t is the hour angle. From the time of the minimum shadow length we can get the hour angle values. That's just the number of minutes before or after local apparent noontime. With the gnomon height g and the shadow lengths we get the elevation angle. We can measure the X-values of the ends of the gnomon shadow more easily than the Y-values. With the total shadow lengths and the X-values and the Pythagorean theorem we get the Y's. Some simple computer code gives us the azimuths.
The data from December 21, 2010, gives -23 deg 41.1 +/- 9.5 min as the declination of the Sun from such analysis. The data from June 21, 2010, gives DEC = +23 deg 56.8+/- 7.2 min. Thus, the obliquity of the ecliptic from data of these two dates is 23 deg 49.0 +/- 7.8 min. We used only points an hour or more from the meridian. You don't want a small numerical value of sin(t) in the denominator.
Using the data from June 21 and December 21, there is a maximum elevation angle of the Sun for each date, as observed from the same site. Call those h_max(Jun 21) and h_max(Dec 21). It is easy to show that
latitude = phi = 90 - [h_max(Jun21) + h_max(Dec 21)]/2
and
obliquity of the ecliptic = epsilon = [h_max(Jun 21) - h_max(Dec 21)]/2
The data on the meridian from June 21 and December 21 gave 23 deg 0.9 +/- 5.0 min for the obliquity. The average of this result and the result given above from the derivation of the Sun's declination from 1 to 2 hours either side of the meridian is 23 deg 25 min, which matches almost exactly the right answer from the most accurate observations (namely 23 deg 26.2 min). Admittedly, the uncertainty of our value of epsilon is about +/- 0.4 deg.
For a homework assignment that contains the raw data from June 21, 2010, and December 21, 2010, click here . In the latter dataset there is an intentional transcription error. The correct shadow length at 12:15:00 CST was 754.5, not 734.5 mm. This was put in so that the students could judge the quality of the data from their plots and contemplate "outliers". In this homework assignment one can derive the latitude of College Station, Texas, and the obliquity of the ecliptic without using any solar declinations from the Astronomical Almanac.
Determining the latitude and longitude of Easter Island
Easter Island is located about halfway between Santiago, Chile, and Tahiti. While it is part of Polynesia, it has been part of the Republic of Chile since September 9, 1888. For more information click here.
I was on Easter Island in December of 2006 and carried out the gnomon experiment there too. I knew that the Sun would pass north of the zenith at local noon and that it would pass roughly 3 1/2 degrees from the zenith. The first thing to do was to determine the approximate time of local noon. That occurred about 2:15 PM, which is 19:15 Greenwich Mean Time. This told me two things: 1) Easter Island has a somewhat artificial clock time. The clock time should really be about two hours earlier. I suspect that for economic reasons with the Chilean mainland they keep Easter Island time intentionally closer to Santiago time. 2) Easter Island is roughly 7 1/4 hours (109 degrees) west of the Greenwich meridian.
The graph below gives an X-Y plot of the position of the point of the gnomon over a 3 hour and 46 minute period on December 18, 2006. Because the Sun came so close to the zenith, the position of the point of the gnomon was actually within the shadow of the cylinder of the stick. The green dots are points when one could see the shadow of the gnomon point. The blue triangles and cyan squares correspond to times when the shadow of the point was within the shadow of the cylinder of the stick. The cyan squares correspond to times when the end of the shadow was on the block that holds up the gnomon. By sighting down on the gnomon towards the end of the shadow of the cylinder, one can estimate the location of the point of the gnomon within the shadow of the cylinder. The block is 37 millimeters in height. I have scaled the X-Y coordinates of the cyan squares by (636/599) to account for this. This is to say that all the points in the graph correspond to the position of the gnomon point on the ground, with a gnomon height of 636 mm. Notice how little space this set of data takes up compared to the datasets shown above for mid-northern latitudes. As in the other X-Y graphs above, north is up, west to the left.

The shadow length vs. time since 19 hours GMT is given below:
It is clear that the points can not be fit by a parabola. Instead, I have fit a fourth order polynomical through the 11 points centered on local noon. I obtain a minimum shadow length of 43.1 +/- 1.3 mm.
Just in case anyone is confused, my gnomon detaches from the block that holds it up. So it should not be that surprising if different experiments have slightly different values for the gnomon height.
From the Astronomical Alamanac the coordinates of the Sun at the time of local noon on Easter Island on December 18, 2006, were: RA = 17 h 45 m 43.6 s; DEC = -23 deg 23' 58.9" = -23.3997 deg.
Equation of time = 3 min 3.9 sec.
Semi-diameter of Sun = 16.3'.
The maximum elevation angle of the upper limb of the Sun was:
h_max = arctan [ (636 +/- 1) / (43.1 +/- 1.3) ] = 86.1231 (+0.1134, -0.1208) deg.
Things get a bit tricky keeping track of the minus signs here, since the observations were made in the southern hemisphere at a latitude further south than the DEC of the Sun. The latitude PHI = - (90 - 86.1231) - 23.3997 = -27.2766 deg = -27 deg 16.6'. The Sun was north of zenith and the end of the umbral shadow corresponds to the upper limb of the Sun. We obtain our final latitude value by adjusting the location further from the equator, so we must subtract the semi-diameter of the Sun for this experiment done in the southern hemisphere. The final latitude value is -27 deg 16.6' - 16.3' = -27 deg 32.9' Given the uncertainty of the height of the gnomon and the minimum length of the shadow, the uncertainty of the latitude is +/- 7.0' = +/- 7.0 nautical miles.
To determine the best value for the the time of local noon (when the Sun transits the celestial meridian), I used the 9 final data points and determined at what time prior to local noon the shadow had the same length. Thus, I did some interpolation of the pre-noon shadow lengths. The mean transit time obtained was 19:14:08 GMT, with a small uncertainty of +/- 7 sec. Given the Equation of Time, the fictitious mean Sun transitted 3 min and 3.9 sec later than 19:14:08 GMT, or 19:17:11.9. Thus, my location on Easter Island was 17 min and 11.9 sec (4.300 deg) west of the 7 hour meridian (105 deg West). My value of the longitude on Easter Island is then 109.300 deg = 109 deg 18.0'.
From Google Earth it was determined that the true location where my experiment was carried out was PHI = -27 deg 09.6', longitude = 109 deg 26.5'. (These ought to be double checked, since a different web map gave a longitude almost 1' different.) For now, my systematic errors are: latitude: |32.9 - 9.6| = 7.0', which is 3.3 times the random error. This means that we could expect to improve on the experiment if we carried it out again with the same equipment. But given how close the Sun came to the zenith, I think we did pretty well.
Systematic error in longitude = |18.0 - 26.5| = 8.5'
8.5 * cos(PHI) = 7.55. My linear error was sqrt (7.55*7.55 + 23.3 * 23.3) = 24.5 nautical miles.
How well did undergraduate students do on this experiment?
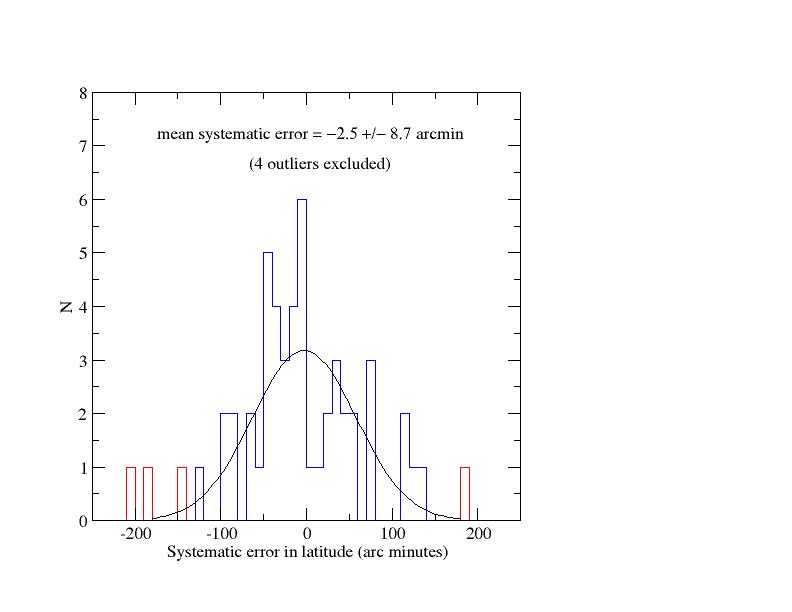
In the fall of 2007 I gave this project to my students in Basic Astronomy at Texas A&M. The students turned in 53 projects. Even after correcting all their arithmetic, there were a number of outliers. One project's value was several degrees off. Four others were more than 2.5 degrees off. For 48 values the mean systematic error was -2.5 +/- 8.7' (mean error of the mean). The median systematic error was -8.8'. For the graph below I adopted a mean solar radius of 16.1 arcmin, as the projects were carried out in October and November 2007 when that was the mean angular radius of the Sun. I think this is a remarkable demonstration of the method and the power of statistics.
How could the data have been more accurate?
1) Use a level to make sure that the surface where the data are taken is, in fact, level.
2) Use a plumb line to make sure that the gnomon is as close to vertical as possible. I actually did this for the College Station measurements, but did not state this above.
3) Use a demonstrably straight, metal gnomon. My 3/8-inch dowel rod is slightly curved. Wood warps over time and also changes size. Once astronomers in the 16th century such as Tycho Brahe started using metal instruments, they obtained much more accurate measures of the positions of the Sun, Moon, and stars.
4) Determine a better way of deciding where the end of the dark part (umbra) of the gnomon's shadow ends. Just like the Earth's shadow directed at the full Moon on the day of a lunar eclipse, there is a dark shadow and a semi-shadow (the penumbra ) of the gnomon.
5) The air in the Earth's atmosphere refracts light, causing celestial objects to appear higher in the sky. On the horizon at sea level this amounts to about 35 arc minutes, or nearly 0.6 degrees. Thus, if the bottom edge of the Sun is "just touching" the horizon, the Sun is actually all below the horizon. It is only the image of the Sun you are seeing, refracted around the "edge" of the Earth, so to speak.
Higher up in the sky the refraction correction is approximately equal to 60.6 arc seconds (about 1.0 arc minute) times the cotangent of the apparent elevation angle above the horizon. For our South Bend observations the true Sun was actually 0.7' lower in the sky, implying that our latitude was 0.7' further north, or 41 deg 52.2'. Thus, our systematic error in latitude is increased slightly to 10.45 nautical miles. For College Station on 11/12/2006 the refraction correction was 1.1', giving us a corrected latitude of 30 deg 34.2', reducing our systematic error from -4.1 to -3.0 nautical miles.
Determining the circumference of the Earth
I kept track of the mileage on my car from South Bend to College Station and kept track of the mileage of a few short side trips along the way. Along the route that I took, the mileage from one site of the shadow measurements to the other was 1248.8 statute miles. But I did not drive a great circle route from one place to the other.
The shortest distance between two points on the surface of a sphere is the great circle route. If you pass a plane through the center of the sphere and through the two points, that will delineate the shortest route along the surface of the sphere. This is why, when you fly from San Francisco to Japan, you fly very far north. It looks like you are going out of your way, but you're not.
From my Rand McNally Road Atlas I estimate that a "straight line" from Nieuwland Science Hall on the Notre Dame campus to the Zachary Engineering Building at Texas A & M was 81 percent of my odometer mileage, or 1011.5 miles.
Given the derived latitudes and longitudes of the two sites, I calculate that they were 14.034 degrees apart along a great circle route. Thus, an estimate of the circumference of the Earth (C) from these measurements is:
C = 360/14.034 * 1011.5 = 25,947 statute miles.
The true value is 24,901 miles. Thus, our derived value is roughly 4.2 percent too large. Much of the systematic error is due to this factor of 81 percent to correct my odometer mileage to the "straight shot" mileage. You can believe that the actual route I drove was more squiggly than the resolution of the map in the road atlas can show. So the factor of 0.81 is probably an upper limit. We would have gotten the "correct" value of the Earth's circumference if our correction factor had been 0.777.
A related question you might ask is this: how do we know that my odometer has no systematic scaling error of its own? In fact, while driving along Interstate 55 in Illinois I noted that 98 miles according to the mile markers was the same as 96.8 miles on my odometer. Thus, if the mile markers were really accurate, I was underestimating the distance from point A to point B by 1.2 percent. Our "best" value of the circumference of the Earth might be 5.5 percent in error, not just 4.3 percent. But....how do we know if the mile markers were put down accurately? Would my odometer have given the same mileage if my tires had been inflated more? As you can see, the questions never end. This is a common feature of scientific measurements.
I note that in real scientific research one does not know the "true answer" of what we are trying to measure. There are quantifiable numerical uncertainties, but the results always end up having a mixture of random and systematic errors. Yet, if two independent researchers measure the same thing, they should get the same answer, within the errors. A comparison of their two data sets allows one to estimate the size of the systematic errors.
Go back to Kevin Krisciunas home page by clicking here.